By the spring of 2020, the high stakes involved in rigorous, timely and honest statistics had suddenly become all too clear. A new coronavirus was sweeping the world. Politicians had to make their most consequential decisions in decades, and fast. Many of those decisions depended on data detective work that epidemiologists, medical statisticians and economists were scrambling to conduct. Tens of millions of lives were potentially at risk. So were billions of people’s livelihoods.
In early April, countries around the world were a couple of weeks into lockdown, global deaths passed 60,000, and it was far from clear how the story would unfold. Perhaps the deepest economic depression since the 1930s was on its way, on the back of a mushrooming death toll. Perhaps, thanks to human ingenuity or good fortune, such apocalyptic fears would fade from memory. Many scenarios seemed plausible. And that’s the problem.
An epidemiologist, John Ioannidis, wrote in mid-March that Covid-19 “might be a once-in-a-century evidence fiasco”. The data detectives are doing their best – but they’re having to work with data that’s patchy, inconsistent and woefully inadequate for making life-and-death decisions with the confidence we would like.
Details of this fiasco will, no doubt, be studied for years to come. But some things already seem clear. At the beginning of the crisis, politics seem to have impeded the free flow of honest statistics. Although the claim is contested, Taiwan complained that in late December 2019 it had given important clues about human-to-human transmission to the World Health Organization – but as late as mid-January, the WHO was reassuringly tweeting that China had found no evidence of human-to-human transmission. (Taiwan is not a member of the WHO, because China claims sovereignty over the territory and demands that it should not be treated as an independent state. It’s possible that this geopolitical obstacle led to the alleged delay.)
Did this matter? Almost certainly; with cases doubling every two or three days, we will never know what might have been different with an extra couple of weeks of warning. It’s clear that many leaders took a while to appreciate the potential gravity of the threat. President Trump, for instance, announced in late February: “It’s going to disappear. One day it’s like a miracle, it will disappear.” Four weeks later, with 1,300 Americans dead and more confirmed cases in the US than any other country, Trump was still talking hopefully about getting everybody to church at Easter.
As I write, debates are raging. Can rapid testing, isolation and contact tracing contain outbreaks indefinitely, or merely delay their spread? Should we worry more about small indoor gatherings or large outdoor ones? Does closing schools help to prevent the spread of the virus, or do more harm as children go to stay with vulnerable grandparents? How much does wearing masks help? These and many other questions can be answered only by good data about who has been infected, and when.
But in the early months of the pandemic, a vast number of infections were not being registered in official statistics, owing to a lack of tests. And the tests that were being conducted were giving a skewed picture, being focused on medical staff, critically ill patients, and – let’s face it – rich, famous people. It took several months to build a picture of how many mild or asymptomatic cases there are, and hence how deadly the virus really is. As the death toll rose exponentially in March, doubling every two days in the UK, there was no time to wait and see. Leaders put economies into an induced coma – more than 3 million Americans filed jobless claims in a single week in late March, five times the previous record. The following week was even worse: more than 6.5m claims were filed. Were the potential health consequences really catastrophic enough to justify sweeping away so many people’s incomes? It seemed so – but epidemiologists could only make their best guesses with very limited information.
It’s hard to imagine a more extraordinary illustration of how much we usually take accurate, systematically gathered numbers for granted. The statistics for a huge range of important issues that predate the coronavirus have been painstakingly assembled over the years by diligent statisticians, and often made available to download, free of charge, anywhere in the world. Yet we are spoiled by such luxury, casually dismissing “lies, damned lies and statistics”. The case of Covid-19 reminds us how desperate the situation can become when the statistics simply aren’t there.
When it comes to interpreting the world around us, we need to realise that our feelings can trump our expertise. This explains why we buy things we don’t need, fall for the wrong kind of romantic partner, or vote for politicians who betray our trust. In particular, it explains why we so often buy into statistical claims that even a moment’s thought would tell us cannot be true. Sometimes, we want to be fooled.
Psychologist Ziva Kunda found this effect in the lab, when she showed experimental subjects an article laying out the evidence that coffee or other sources of caffeine could increase the risk to women of developing breast cysts. Most people found the article pretty convincing. Women who drank a lot of coffee did not.
We often find ways to dismiss evidence that we don’t like. And the opposite is true, too: when evidence seems to support our preconceptions, we are less likely to look too closely for flaws. It is not easy to master our emotions while assessing information that matters to us, not least because our emotions can lead us astray in different directions.
We don’t need to become emotionless processors of numerical information – just noticing our emotions and taking them into account may often be enough to improve our judgment. Rather than requiring superhuman control of our emotions, we need simply to develop good habits. Ask yourself: how does this information make me feel? Do I feel vindicated or smug? Anxious, angry or afraid? Am I in denial, scrambling to find a reason to dismiss the claim?
In the early days of the coronavirus epidemic, helpful-seeming misinformation spread even faster than the virus itself. One viral post – circulating on Facebook and email newsgroups – all-too-confidently explained how to distinguish between Covid-19 and a cold, reassured people that the virus was destroyed by warm weather, and incorrectly advised that iced water was to be avoided, while warm water kills any virus. The post, sometimes attributed to “my friend’s uncle”, sometimes to “Stanford hospital board” or some blameless and uninvolved paediatrician, was occasionally accurate but generally speculative and misleading. But still people – normally sensible people – shared it again and again and again. Why? Because they wanted to help others. They felt confused, they saw apparently useful advice, and they felt impelled to share. That impulse was only human, and it was well-meaning – but it was not wise.
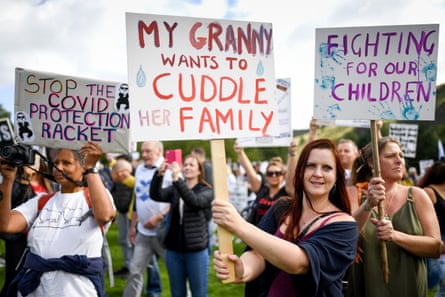
Protestors in Edinburgh demonstrating against Covid-19 prevention measures. Photograph: Jeff J Mitchell/Getty Images
Before I repeat any statistical claim, I first try to take note of how it makes me feel. It’s not a foolproof method against tricking myself, but it’s a habit that does little harm, and is sometimes a great deal of help. Our emotions are powerful. We can’t make them vanish, and nor should we want to. But we can, and should, try to notice when they are clouding our judgment.
In 1997, the economists Linda Babcock and George Loewenstein ran an experiment in which participants were given evidence from a real court case about a motorbike accident. They were then randomly assigned to play the role of plaintiff’s attorney (arguing that the injured motorcyclist should receive $100,000 in damages) or defence attorney (arguing that the case should be dismissed or the damages should be low).
The experimental subjects were given a financial incentive to argue their side of the case persuasively, and to reach an advantageous settlement with the other side. They were also given a separate financial incentive to accurately guess what the damages the judge in the real case had actually awarded. Their predictions should have been unrelated to their role-playing, but their judgment was strongly influenced by what they hoped would be true.
Psychologists call this “motivated reasoning”. Motivated reasoning is thinking through a topic with the aim, conscious or unconscious, of reaching a particular kind of conclusion. In a football game, we see the fouls committed by the other team but overlook the sins of our own side. We are more likely to notice what we want to notice. Experts are not immune to motivated reasoning. Under some circumstances their expertise can even become a disadvantage. The French satirist Molière once wrote: “A learned fool is more foolish than an ignorant one.” Benjamin Franklin commented: “So convenient a thing is it to be a reasonable creature, since it enables us to find or make a reason for everything one has a mind to.”
Modern social science agrees with Molière and Franklin: people with deeper expertise are better equipped to spot deception, but if they fall into the trap of motivated reasoning, they are able to muster more reasons to believe whatever they really wish to believe.
One recent review of the evidence concluded that this tendency to evaluate evidence and test arguments in a way that is biased towards our own preconceptions is not only common, but just as common among intelligent people. Being smart or educated is no defence. In some circumstances, it may even be a weakness.
One illustration of this is a study published in 2006 by two political scientists, Charles Taber and Milton Lodge. They wanted to examine the way Americans reasoned about controversial political issues. The two they chose were gun control and affirmative action.
Taber and Lodge asked their experimental participants to read a number of arguments on either side, and to evaluate the strength and weakness of each argument. One might hope that being asked to review these pros and cons might give people more of a shared appreciation of opposing viewpoints; instead, the new information pulled people further apart.
This was because people mined the information they were given for ways to support their existing beliefs. When invited to search for more information, people would seek out data that backed their preconceived ideas. When invited to assess the strength of an opposing argument, they would spend considerable time thinking up ways to shoot it down.
This isn’t the only study to reach this sort of conclusion, but what’s particularly intriguing about Taber and Lodge’s experiment is that expertise made matters worse. More sophisticated participants in the experiment found more material to back up their preconceptions. More surprisingly, they found less material that contradicted them – as though they were using their expertise actively to avoid uncomfortable information. They produced more arguments in favour of their own views, and picked up more flaws in the other side’s arguments. They were vastly better equipped to reach the conclusion they had wanted to reach all along.
Of all the emotional responses we might have, the most politically relevant are motivated by partisanship. People with a strong political affiliation want to be on the right side of things. We see a claim, and our response is immediately shaped by whether we believe “that’s what people like me think”.
Consider this claim about climate change: “Human activity is causing the Earth’s climate to warm up, posing serious risks to our way of life.” Many of us have an emotional reaction to a claim like that; it’s not like a claim about the distance to Mars. Believing it or denying it is part of our identity; it says something about who we are, who our friends are, and the sort of world we want to live in. If I put a claim about climate change in a news headline, or in a graph designed to be shared on social media, it will attract attention and engagement not because it is true or false, but because of the way people feel about it.
If you doubt this, ponder the findings of a Gallup poll conducted in 2015. It found a huge gap between how much Democrats and Republicans in the US worried about climate change. What rational reason could there be for that?
Scientific evidence is scientific evidence. Our beliefs around climate change shouldn’t skew left and right. But they do. This gap became wider the more education people had. Among those with no college education, 45% of Democrats and 23% of Republicans worried “a great deal” about climate change. Yet among those with a college education, the figures were 50% of Democrats and 8% of Republicans. A similar pattern holds if you measure scientific literacy: more scientifically literate Republicans and Democrats are further apart than those who know very little about science.
If emotion didn’t come into it, surely more education and more information would help people to come to an agreement about what the truth is – or at least, the current best theory? But giving people more information seems actively to polarise them on the question of climate change. This fact alone tells us how important our emotions are. People are straining to reach the conclusion that fits with their other beliefs and values – and the more they know, the more ammunition they have to reach the conclusion they hope to reach.
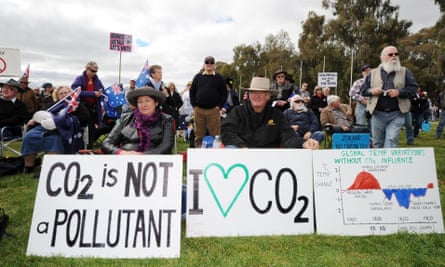
Anti-carbon tax protesters in Australia in 2011. Photograph: Torsten Blackwood/AFP/Getty Images
In the case of climate change, there is an objective truth, even if we are unable to discern it with perfect certainty. But as you are one individual among nearly 8 billion on the planet, the environmental consequences of what you happen to think are irrelevant. With a handful of exceptions – say, if you’re the president of China – climate change is going to take its course regardless of what you say or do. From a self-centred point of view, the practical cost of being wrong is close to zero. The social consequences of your beliefs, however, are real and immediate.
Imagine that you’re a barley farmer in Montana, and hot, dry summers are ruining your crop with increasing frequency. Climate change matters to you. And yet rural Montana is a conservative place, and the words “climate change” are politically charged. Anyway, what can you personally do about it?
Here’s how one farmer, Erik Somerfeld, threads that needle, as described by the journalist Ari LeVaux: “In the field, looking at his withering crop, Somerfeld was unequivocal about the cause of his damaged crop – ‘climate change’. But back at the bar, with his friends, his language changed. He dropped those taboo words in favour of ‘erratic weather’ and ‘drier, hotter summers’ – a not-uncommon conversational tactic in farm country these days.”
If Somerfeld lived in Portland, Oregon, or Brighton, East Sussex, he wouldn’t need to be so circumspect at his local tavern – he’d be likely to have friends who took climate change very seriously indeed. But then those friends would quickly ostracise someone else in the social group who went around loudly claiming that climate change is a Chinese hoax.
So perhaps it is not so surprising after all to find educated Americans poles apart on the topic of climate change. Hundreds of thousands of years of human evolution have wired us to care deeply about fitting in with those around us. This helps to explain the findings of Taber and Lodge that better-informed people are actually more at risk of motivated reasoning on politically partisan topics: the more persuasively we can make the case for what our friends already believe, the more our friends will respect us.
It’s far easier to lead ourselves astray when the practical consequences of being wrong are small or non-existent, while the social consequences of being “wrong” are severe. It’s no coincidence that this describes many controversies that divide along partisan lines.
It’s tempting to assume that motivated reasoning is just something that happens to other people. I have political principles; you’re politically biased; he’s a fringe conspiracy theorist. But we would be wiser to acknowledge that we all think with our hearts rather than our heads sometimes.
Kris De Meyer, a neuroscientist at King’s College, London, shows his students a message describing an environmental activist’s problem with climate change denialism:
To summarise the climate deniers’ activities, I think we can say that:
(1) Their efforts have been aggressive while ours have been defensive.
(2) The deniers’ activities are rather orderly – almost as if they had a plan working for them.
I think the denialist forces can be characterised as dedicated opportunists. They are quick to act and seem to be totally unprincipled in the type of information they use to attack the scientific community. There is no question, though, that we have been inept in getting our side of the story, good though it may be, across to the news media and the public.
The students, all committed believers in climate change, outraged at the smokescreen laid down by the cynical and anti-scientific deniers, nod in recognition. Then De Meyer reveals the source of the text. It’s not a recent email. It’s taken, sometimes word for word, from an infamous internal memo written by a cigarette marketing executive in 1968. The memo is complaining not about “climate deniers” but about “anti-cigarette forces”, but otherwise, few changes were required.
You can use the same language, the same arguments, and perhaps even have the same conviction that you’re right, whether you’re arguing (rightly) that climate change is real or (wrongly) that the cigarette-cancer link is not.
(Here’s an example of this tendency that, for personal reasons, I can’t help but be sensitive about. My left-leaning, environmentally conscious friends are justifiably critical of ad hominem attacks on climate scientists. You know the kind of thing: claims that scientists are inventing data because of their political biases, or because they’re scrambling for funding from big government. In short, smearing the person rather than engaging with the evidence.
Yet the same friends are happy to embrace and amplify the same kind of tactics when they are used to attack my fellow economists: that we are inventing data because of our political biases, or scrambling for funding from big business. I tried to point out the parallel to one thoughtful person, and got nowhere. She was completely unable to comprehend what I was talking about. I’d call this a double standard, but that would be unfair – it would suggest that it was deliberate. It’s not. It’s an unconscious bias that’s easy to see in others and very hard to see in ourselves.)
Our emotional reaction to a statistical or scientific claim isn’t a side issue. Our emotions can, and often do, shape our beliefs more than any logic. We are capable of persuading ourselves to believe strange things, and to doubt solid evidence, in service of our political partisanship, our desire to keep drinking coffee, our unwillingness to face up to the reality of our HIV diagnosis, or any other cause that invokes an emotional response.
But we shouldn’t despair. We can learn to control our emotions – that is part of the process of growing up. The first simple step is to notice those emotions. When you see a statistical claim, pay attention to your own reaction. If you feel outrage, triumph, denial, pause for a moment. Then reflect. You don’t need to be an emotionless robot, but you could and should think as well as feel.
Most of us do not actively wish to delude ourselves, even when that might be socially advantageous. We have motives to reach certain conclusions, but facts matter, too. Lots of people would like to be movie stars, billionaires or immune to hangovers, but very few people believe that they actually are. Wishful thinking has limits. The more we get into the habit of counting to three and noticing our knee-jerk reactions, the closer to the truth we are likely to get.
For example, one survey, conducted by a team of academics, found that most people were perfectly able to distinguish serious journalism from fake news, and also agreed that it was important to amplify the truth, not lies. Yet the same people would happily share headlines such as “Over 500 ‘Migrant Caravaners’ Arrested With Suicide Vests”, because at the moment at which they clicked “share”, they weren’t stopping to think. They weren’t thinking, “Is this true?”, and they weren’t thinking, “Do I think the truth is important?”
Instead, as they skimmed the internet in that state of constant distraction that we all recognise, they were carried away with their emotions and their partisanship. The good news is that simply pausing for a moment to reflect was all it took to filter out a lot of the misinformation. It doesn’t take much; we can all do it. All we need to do is acquire the habit of stopping to think.
Inflammatory memes or tub-thumping speeches invite us to leap to the wrong conclusion without thinking. That’s why we need to be calm. And that is also why so much persuasion is designed to arouse us – our lust, our desire, our sympathy or our anger. When was the last time Donald Trump, or for that matter Greenpeace, tweeted something designed to make you pause in calm reflection? Today’s persuaders don’t want you to stop and think. They want you to hurry up and feel. Don’t be rushed.